But investors say
they would prefer to join the trend even earlier. This desire turns a
‘safe’ trend trade into a higher risk breakout trade.
Many people want to abandon a strongly performing trend trade well
before any indicator signals confirmed the trend had ended.
Just as many traders are uncomfortable with entering a trend trade late,
they are also uncomfortable in waiting to get out of a trend trade after
the end of the trend has been confirmed. The result is that many
excellent trades are turned into poor trades because traders do not have
the discipline to follow their trading plan.
We face the same temptations with the notional case study trade with BAX.
This is an example of a trend trade based on a mid trend entry.
The straight edge trend line is the absolute stop loss in this trade.
However, a sustained price fall below the value of the 30 day moving
average is also a signal of trend weakness. Should this happen, the
trade objective shifts to closer management to limit any capital loss.
Once the trade is profitable this is less of a concern.
The volume traded with BAX is quite low with a 10 day average of around
17,000 shares changing hands. Even at our notional $20,000 position
size, this represents a significant part of a days turnover. Liquidity
risk must be balanced against trend risk and the potential return. We
decided to use BAX to highlight some of the issues associated with
liquidity and trend trading. Our objective is not to select the best
trade possible, but to explore a range of management issues that traders
face.
We keep the notional case study trades at around the same size - $20,000
in value. This makes all the examples easy to compare. With an entry
based on the last point on the original chart on which we asked readers
to complete the analysis, we add 4,660 shares at $4.30. The stop loss is
set on the value of the straight edge trend line. At the time of entry
this is $3.87. This is right on the edge of the maximum loss permissible
which is 2% of total portfolio capital. A fall to this level creates a
loss of $2,003. The slope of the trend line compensates for this. Over
coming weeks the value of the trend line rises. An exit at this level
puts at risk $1,186, or 1.2% of our total trading capital. This is the
advantage of a strong trend. The stop loss point lifts as each day
passes so the risk in the trade is reduced.
When we look at the BAX chart we may feel many emotions. The trend
appears to have stopped. Over the past few weeks, as the market has also
faltered, the BAX trend has faltered. This no longer looks as attractive
as it did when the trade was first selected. It does not take much
thought to come up with several reasons for getting out of this trade.
It takes more thought to apply the trading plan and make a rational, not
emotional decision.
We start with the two
moving averages. We use a 10 and 30 day combination. This has been a
good combination for defining the BAX trend in the past. This indicator
has a very clear way to defining a trend. While the 10 day average
remains above the 30 day average the uptrend is still in place. The
current chart extract shows this is still the case. We might argue that
the 10 day average is moving towards the 30 day average. We might worry
that a moving average crossover is developing. However, we cannot say
that the 10 day average is below the 30 day average and in terms of our
original trading plan, this means the trend is still in place. There is
no exit signal from this indicator and no reason to close the trade.
Defining the trend is an important method for selecting and managing
trades. It is also important to understand the nature of the trend. For
this we use the Guppy Multiple Moving Average. This gives us a better
idea of the stability of the trend. Are traders trying to get out and
are they actively testing the trend? Are investors starting to sell, or
do they buy whenever prices dip? The answer to these questions are
derived from the GMMA.
We start with the long term group of averages. These are well
separated. When prices fall in area A there is no selling amongst
investors. The long term group remains well separated which suggests
that many of them saw the price drop as an opportunity to buy. If they
agreed with traders and saw it as an opportunity to sell then we would
see a compression in the long term group as their idea of value agreed
with the current price.
Stocks have their own individual behavioural patterns. The relationship
between the short and long term groups in area A is mirrored in area B.
This stock moves in consolidation periods, followed by a resumption of
the trend.
The GMMA does not suggest that the trend is weakening, despite the
recent price fall and the drift sideways. Until the GMMA confirms a
weakening or collapse of the trend, our trading plan calls for no
action. On this basis the trade remains open.
Desperate for an exit, some traders look to the Count back Line CBL.
They point to the close in area A which is below the count back line and
use this to confirm their emotional decision to exit. This is an
incorrect application of count back line techniques for several reasons.
This has been covered in detail in recent workshops.
The position of the count back line is correctly plotted. The role of
the count back line helps us to decide how significant it is in terms of
managing the trade. The first role of the count back line is to act as a
protect capital stop loss. The current CBL level is at $4.44. If prices
close below this level we exit the trade – at a small profit.
This means that the CBL line now has a new role as a protect profit stop
and this gives us more flexibility in decision making. A close below the
protect profit stop is a signal for the trader to closely examine the
signals delivered by the other trend indicators – the two moving
averages and the GMMA.
As discussed above, the trend is strong, and there is no confirming
end of trend signal from the moving averages. These strong trend
conditions meant that we ignored the close below the CBL in area A.
In the current display, price remains above the CBL protect profit line,
so no action is called for. The trade remains open.
In every trade we have a choice. We can exercise discipline and stay
with our trading plan. Or we can exercise our emotions and jump ship.
|
Used to set a stop loss point based on the current volatility of the stock. Used to verify and manage continuation of a trend. This can be applied to up trends for long side trading, or to down trends for short side trading. It can be applied as a stand alone indicator to protect trading capital in the early stages of a developing trade. End of trend is signalled by a close below the count back line.
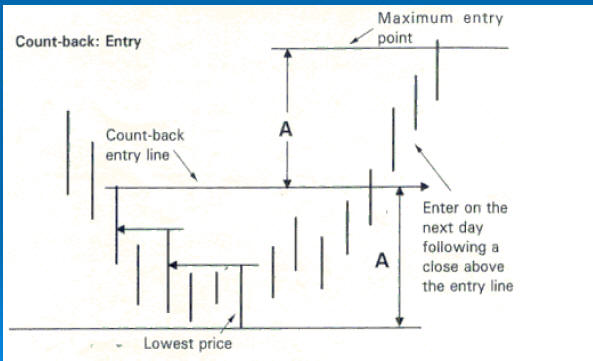
- Use latest Pivot point low as start point
Ignore lower highs as you count back
Draw entry line @ 3 highs up
Include high of start point and gaps
Enter day after closes above 3 day CBL
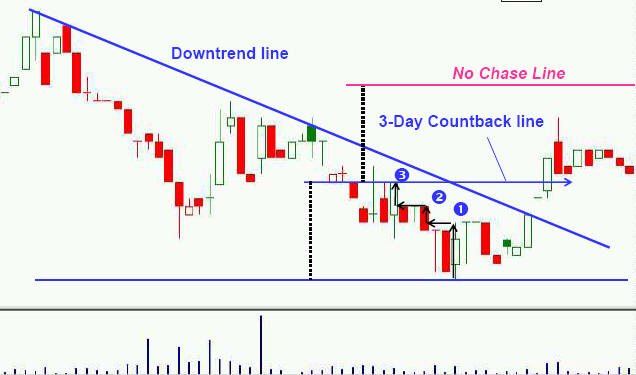
Note - OmniTrader signals are on the next day
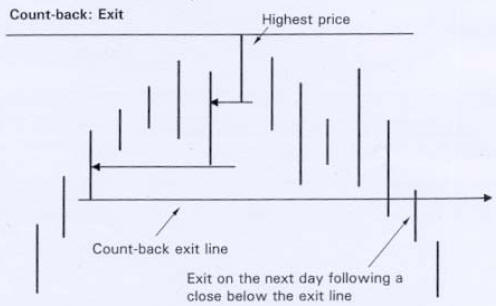
Greed acts dangerously in the exit decision. It is greed that keeps the trader in deteriorating trades. Traders hope prices will climb back to old levels so he can exit. It is greed that keeps him in losing trades - hoping prices will climb back to break even after his stop loss has been passed.
Defining the exit conditions helps control greed. The best exit conditions are based on a set financial return from the trade. The worst are open ended positions that depend on a set of indicator signals. Signals are invariably given after the most recent high. Here the exit is made more difficult because the trader compares what could have been with what is. So he waits, often with disastrous results.
Often although a stop loss signal had been generated, Traders think it should be ignored because the market was in a panic. There are times when this may be appropriate in a strong bull market. It is not appropriate in a bear market.
The OST trade shows why this is the case. In a bear market traders watch the weight of evidence on exit signals and act quickly. Despite the ongoing assurances of many analysts that “the worst is over” and that we have “ a financial system that is protected from sub-prime fallout” or that there is “no evidence of more company collapses “ the charting reality is very different.
The chart speaks with more authority than analysts who do not use charting methods.
The management of the trade uses the value of the trend line, the value of the lower edge of the short term GMMA and the count back line. We look for weight of evidence to prepare for, and act on the exit signal.
The move below the trend line and the value of the lower edge of the short term GMMA is an exit alert signal.
The price activity includes a move below the value of the count back line and Darvas Box .
The day after the trend link break sees a weak rebound. But price remains below the trend line. The short term GMMA compresses and turns down. The close is also below the lower edge of the short term GMMA. This is the first time these conditions have developed since the breakout trend developed in the middle of May. Price has not closed below the CBL line but the trend weakness is particularly strong.
These are exit conditions which cannot be ignored in a bear market.
While it was not possible to anticipate the degree of fall in OST, it was possible to anticipate that the trend was about to end.
Charting analysis of trend strength and behaviour gave clear warning of this trend weakness so traders were able to act to secure effective exit prices.