| How to add a stop loss to a chart |
|
Example - plot an
automatic stop loss based on a strategy |
|
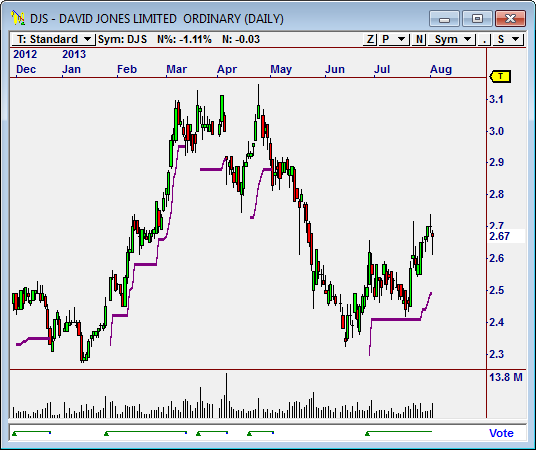
This example shows a trailing loss for an activated strategy, note the
blue lines on the chart are the trailing loss levels and they correspond
to the start points of the strategy activated on the vote line. In
this example the strategy uses an ATR level as a trailing stop loss. The
chart will display
the loss method based on the strategy selected. |
 |
|
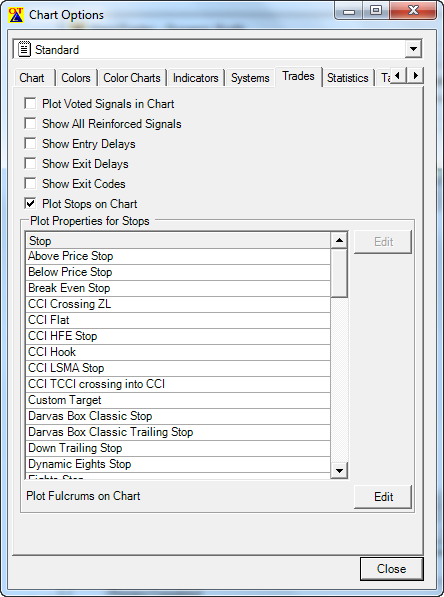
To get the stop loss to appear you need to modify the chart template
you are using - in this example we are modifying the standard chart.
Select >chart options and then select > Trades and tick the > Plot stops
in the chart. This will activate the stops for the strategy used in the
chart. See below. |
 |
|
|
|
Example -
test how different stop loss systems would work when used in a
strategy |
 |
|
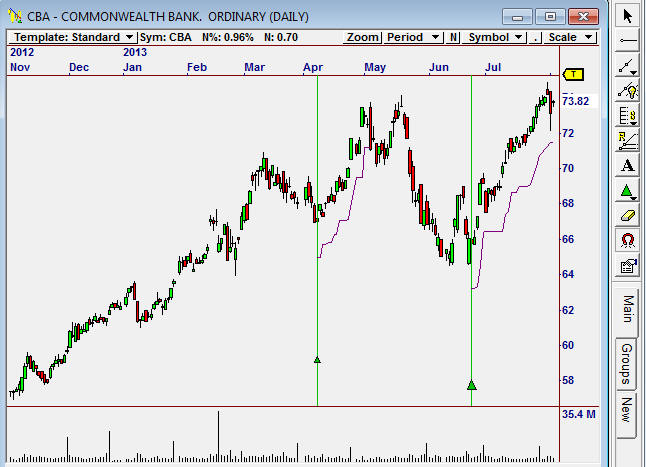
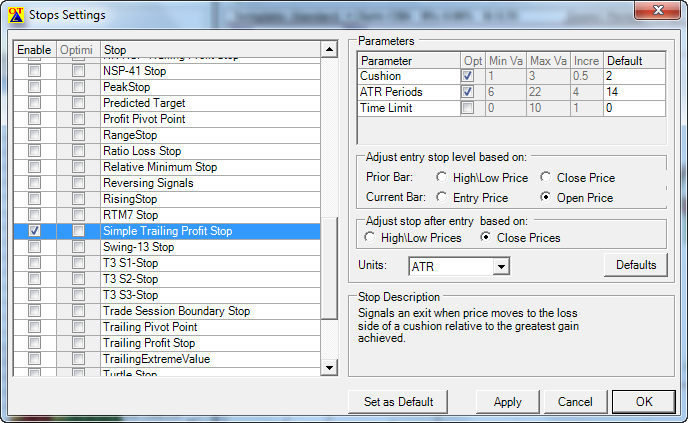
In this example we will use the Draw a Signal tool which in the
green triangle on the right in this example, if you click on it you can
select > go long . Then double click on the chart under the price line
where you would Buy the share. This will bring up an option screen (you
may have less options than shown here). In this example we selected a
simple Trailing Stop line, make sure the Units show ATR and you can
change other options as required. See below. |
 |
|
You will find you can move the Buy green triangle to any position and
see when the stop loss would be triggered in a strategy. |
|
|