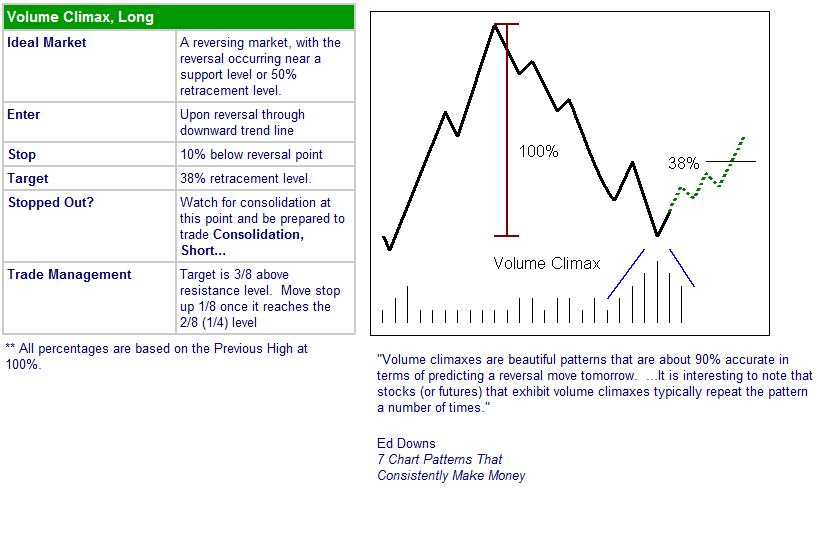
Volume Helps Identify ReversalsVarious price patterns can alert us to potential reversal candidates. Trendline Breaks, Support and Resistance Levels, Fibonacci Retracement Levels and other price information are valuable in determining a change in direction for a security. However, one of the most overlooked chart patterns that help us determine reversals is not reflected in the price itself. Volume climaxes are easily identifiable and valuable in assessing a change in market sentiment. A climax occurs when a market has been trending down (or up) for an extended period of time. As price nears a significant level (support, 50% Retracement level, etc.) volume will increase until price reverses, and then we see volume steadily decrease as the sentiment shifts from the previous trend. Securities that tend to exhibit clear volume climaxes will continue to follow that tendency. If you find a security that reverses with easily identifiable volume climaxes, flag it and continue to check on it to see when the next climax is forming for an early indication of a trend reversal. As you prospect for reversal candidates, watch
for volume climaxes forming to help you confirm the validity of
the reversal. If you can find a volume climax accompanied by
support/resistance, breakaway gap or trendline break, you have
found an excellent trade opportunity. |

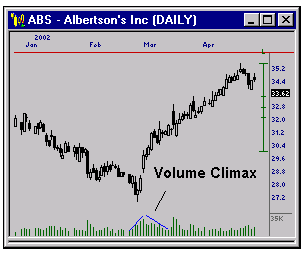
A Volume Climax for ABS signals the end of the downward
trend

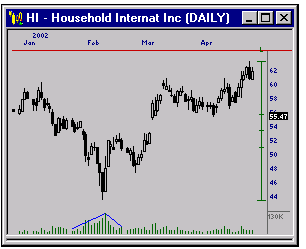
Household Internat Inc shows the end of a sell off
coincides with a Volume Climax.

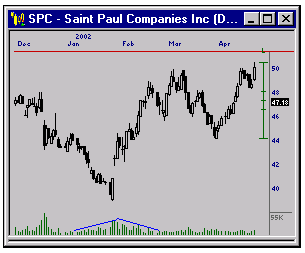
Once sellers are exhausted, buyers can easily move a
stock as we see on SPC
|
