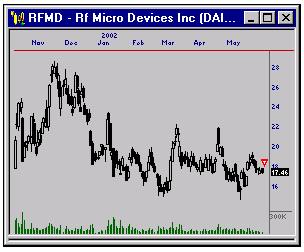
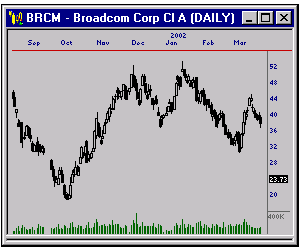
Well Behaved Stocks Reap RewardsSome stocks move multiple points and multiple directions in one trading session. Other stocks are more methodical in their day to day movement. Which type of stock is more attractive to you as an investor? While the attraction of quick moves is hard to overlook, it is important to realize that most of the time the best bet is the safe one. Look at the first chart of RFMD. This stock shows daily moves of 10% in some instances, which is significant for a $20 stock. It is difficult to find a discernable trend, support, resistance, or any chart pattern for that matter. This stock is currently very volatile and should be avoided by position traders (nice intraday moves, though, for real time traders). Sure, there are some big gains there, but what direction to you trade, where do you place your stop and when do you get out? Our next chart, BRCM, shows very well defined trends and price action that is basically "in-line" with the rest of the chart. This is appealing to position traders as well as real time traders, and a well-behaved, less volatile chart like BRCM is one to bookmark for various reasons. When we analyze charts, we are looking for charts with good movement potential as well as a history of behaving in an expected manner. While the dot-com craze is still fresh in our
memories, it is hard to resist the temptation of huge percentage
gains on a daily basis. However, this approach has gone the way
the companies that spawned it, and today's market dictates a
more conservative approach. Look at low volatility stocks like
old friends - on a day-to-day basis, they may not stand out, but
over time their value is easy to identify. |

RFMD - A profile in volatility

Broadcom is a good example of a well behaved stock
|