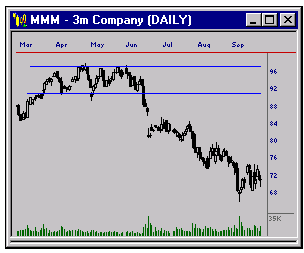
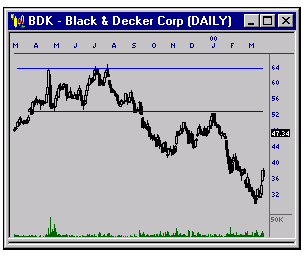
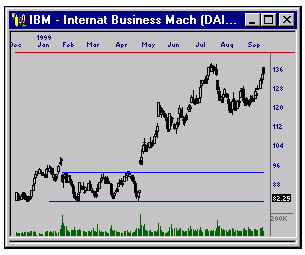
Big Moves Occur Outside of the RangeA trading range is basically a horizontal channel in which a security moves from the high and low of the channel for an extended amount of time. Obviously, the upper level of the range can be considered resistance and the lower level represents support. Trading within a range is possible, but it's the breakout from the range that provides the best opportunities. When price breaks out of the trading range, a continued move in the direction of the breakout can be expected. Some breakouts are stronger than others, and one way to identify a stronger breakout is to look at the duration in which the security has been in the range. Normally, the longer the trading range has been in effect, the stronger the move when the range is violated. Our first chart shows that MM traded in a range for 3 months, but when price fell through this range, it continued to drop for the next 3 months. The second chart shows another good short opportunity as BDK traded in an extended range for almost half a year and then moved steadily downward once the support level of the range was sufficiently penetrated. Our third chart, IBM, gives a great example of a stock really taking off once it had exceeded the resistance level of a narrow range. Like consolidations, trading ranges also offer
built in trade management as the penetrated support or
resistance level gives you an excellent place to place your
initial stop. As with any chart pattern, additional chart
confirmation on the breakout will help increase your odds of
entering a winning trade. |

MMM falls over 20 points after breaking out of its range.

BDK honoured the ranges support level as resistance after
the breakout.

IBM shows huge gains after breaking its range to the
upside.
|