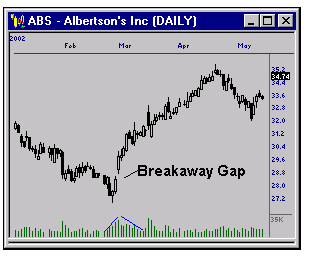
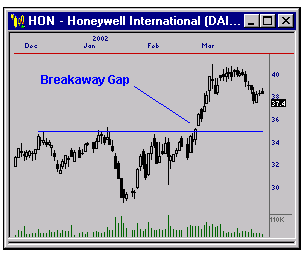
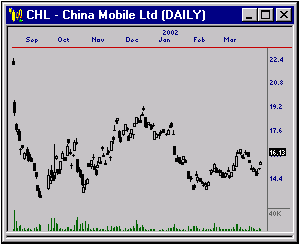
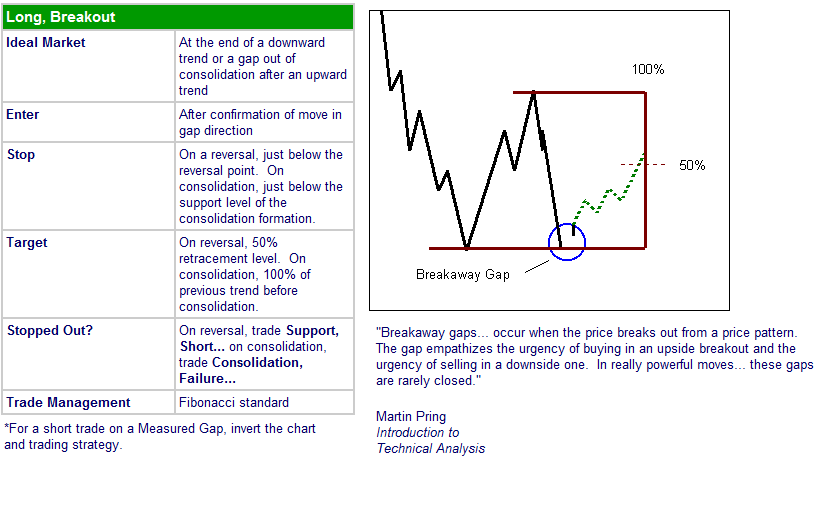
Pressure Helps Identify MoversGaps occur when there is a dramatic change in market conditions. They can occur at the beginning of a trading session (i.e. most NASDAQ stocks) or even during the session itself. There are three types of gaps that are of interest to us when we analyze charts: breakaway, measured (also known as continuation) and exhaustion gaps. Today we will discuss the breakaway gap. Breakaway gaps occur at the end of moves in the opposite direction of the previous trend, signalling a reversal. They can also occur after a consolidation. Either way, they tell us that buying (or selling) pressure is strong and that we can normally expect price to continue in the direction of the gap. Our first example, ABS, shows a nice breakaway gap in mid-February. At the time, how can we know for sure that this is a breakaway gap? By looking at other chart patterns to help us - we also have a trend line break as well as a volume climax at the same time. All three of these patterns indicate a trend reversal. HON gives us an example of a breakaway gap out of consolidation in late February. This gap broke through potential resistance. Other signs of a continued move up are the fact that the gap bar was preceded by a breakout move from an ascending triangle formation. Our final example, CHL, is meant to illustrate the fact that the significance of a gap is relative to the security. When you see a gap occur, be sure and look at the chart and determine whether this gap actually means something or is merely a continuation of normal behaviour. Pay particularly close attention to the significance of a gap on NASDAQ stocks. Breakaway gaps are helpful, but they are NOT
tradable without further confirmation. Notice that in both of
the examples above I made sure to look for other chart patterns
to help confirm the significance of the breakaway gap. Learning
to identify and correctly interpret a breakaway gap will also
help you identify strong reversal and breakout candidates. |

Albertson's has a breakaway gap on a volume climax

Honeywell International gapped through resistance

China Mobile Ltd shows the definition of meaningless gaps
|
