Is your VisualTrader software set up correctly?
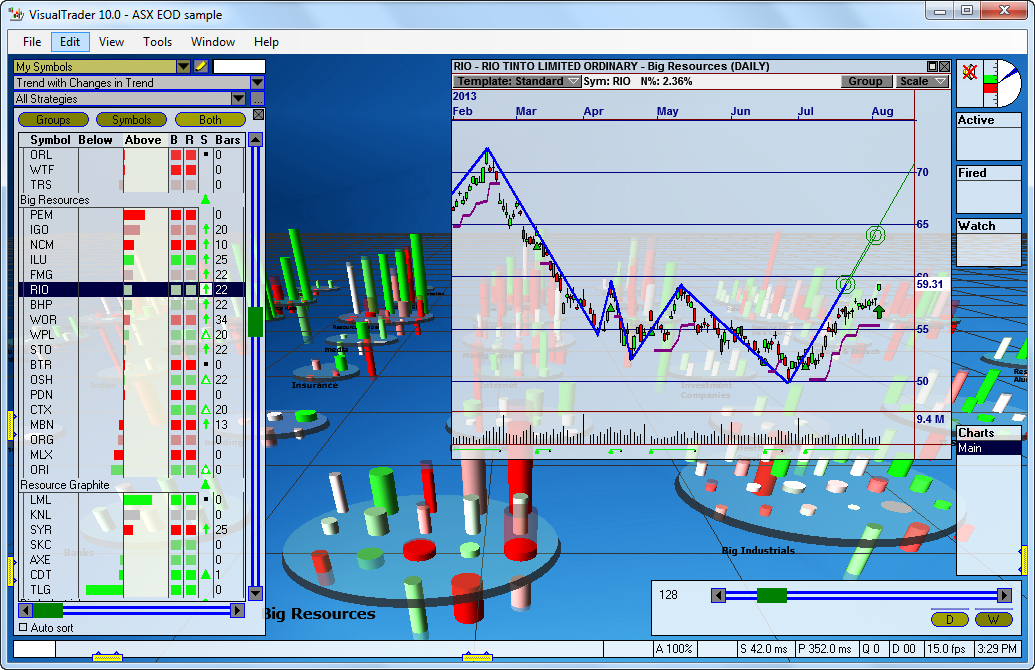
Here is the screen output where the following features have been activated for the purposes of this example
-
Focus list/Map sorted by sectors then symbols, showing buy opportunities and number of days active
-
The Transform - which control the cylinder shape is " Trend with changes in Trend" to highlight trending shares this can be seen on the background charts which show shares within sectors
-
The Strategy selected is Guppy (Multiple Moving Average indicator) and you can see the signals (S) on the focus list and on the chart example you can see the trailing stop loss, the Bars on the focus list are the number of days the signal has been active
-
The Chart shows example of RIO, the standard template has been modified to show cycles this is the dark blue line and on the right is the automatic Fibonacci price target line which has been activated within the chart option 9 available in the Dynamic Profit Module)
-
To learn more about VisualTrader Click Here